It is necessary to analyze correctly every single action to ensure that the time and effort invested in the development of a company or business in social networks has not been wasted. You can figure out which methods are effective, and which ones are useless with the help of special tools. Thanks to the statistics service, the key indicators of the page are visually represented on Facebook. Let’s try in our article to understand more with the statistics of the community and the data obtained.
Subsections of Facebook “Statistics”
Every page of the company has a “Statistics” section. A button with a similar inscription can be found at the top of the community panel. Clicking on the button will open the other page. Various sections will be displayed on the left side. There is a “Browse” button at the top.
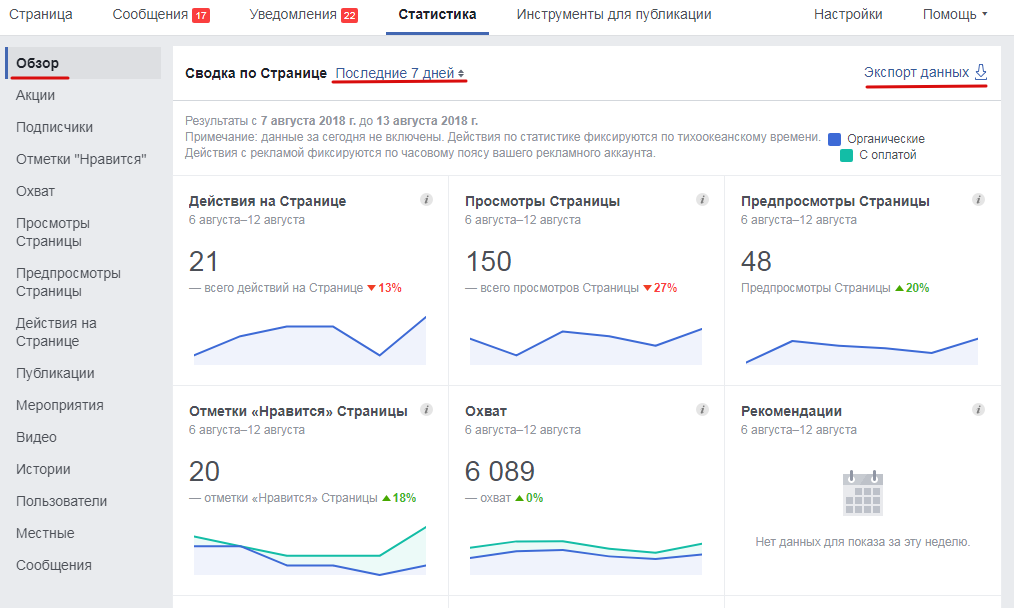
The subsections that we consider in more detail include the following:
- “Subscribers”,
- “Coverage”,
- “Publications”,
- “Users”.
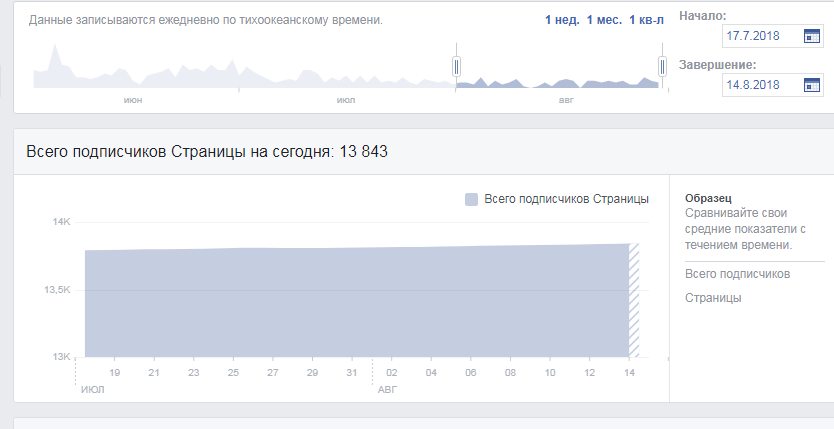
Indicators of the “Subscribers” subsection
In this section, we can see the indicators of the number of subscribers on the page. The final figure is visible on the graph. In addition, here you can see how many subscribers were in a certain period. To do this, we put the dates we need in the lines: “Beginning” and “Completion”.
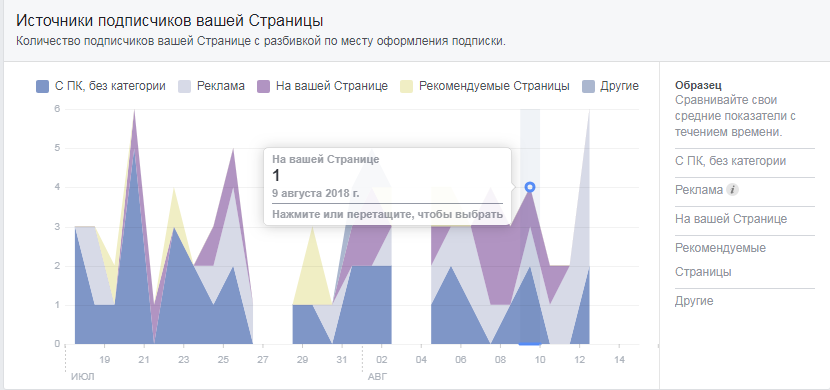
We can see from what sources the users have subscribed to the page in the next line: from the computer, from the Recommended pages, from the Advertising, etc.
There is a graph with indicators of net subscriber growth that is placed below – the number of new subscribers minus the number of comments. Due to it, you can see how many people subscribed through advertising or without the advertising, and how many unsubscribed users are there.
The indicators of this section are important for us because this gives an understanding of how many users have subscribed to us and for what period. In addition, we are to know when and how many unsubscribed users are there. All the values give us an opportunity to analyze the reason for any changes.
Analysis of the “Coverage” department
There are graphs with organic and paid coverage of publications in this subsection. The numbers of organic coverage tell us about how many people saw any publications from the page for free. Here you can also view the indicators for a certain period.
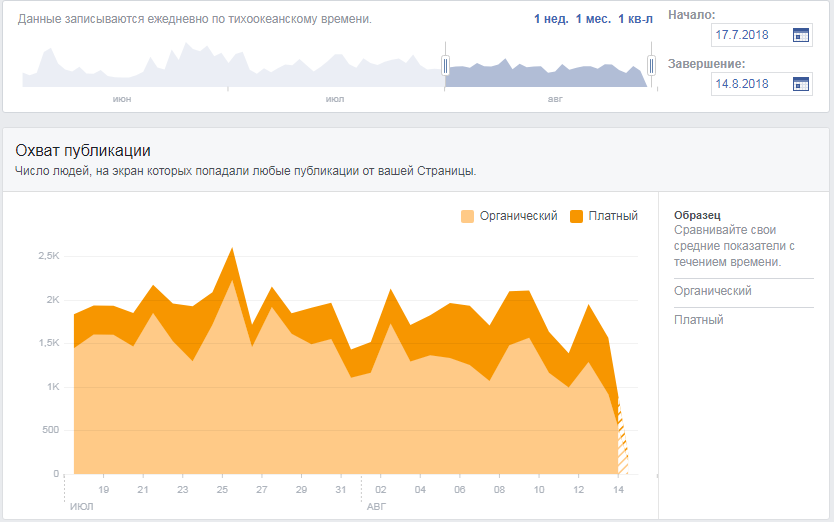
Next are the graphs with the number of social reactions from subscribers for a similar (above indicators) period.
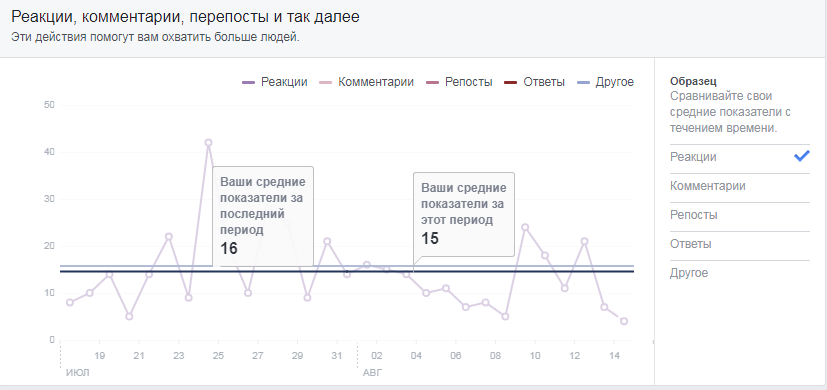
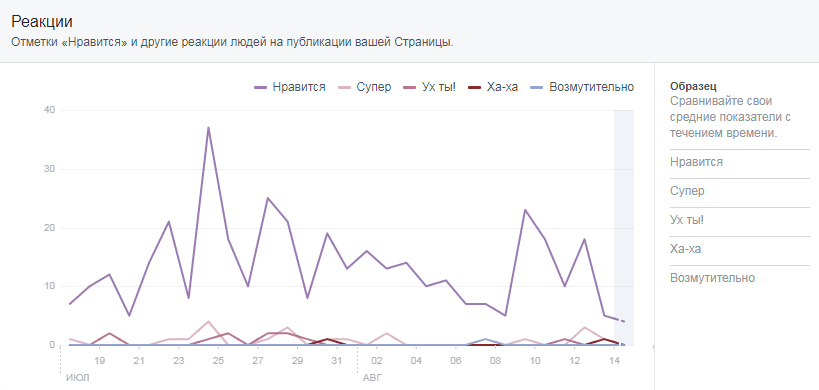
Due to this section, we found out how many people saw the publication of the page, how many left the “Like” or “Super” marks, etc. How many users shared or commented on the publications. This will help to understand which publications attract more attention and to create the materials the people will be more willing to interact with.
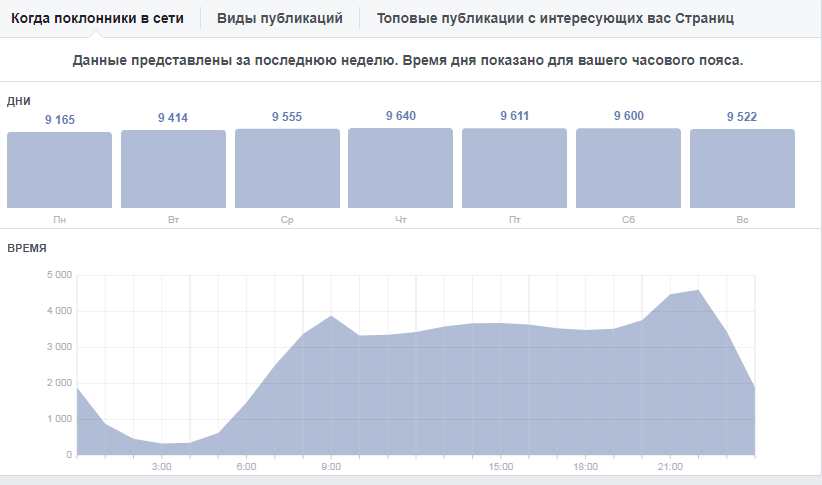
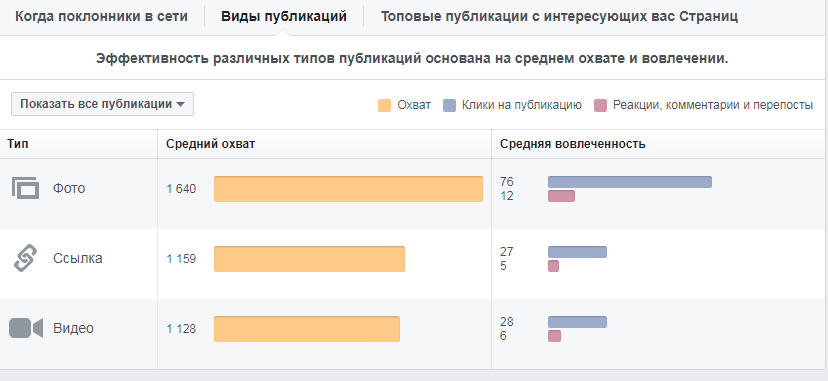
Data analysis in the “Publications” section
Using the data in this subsection, we can find out at what time of a day and day of the week our audience is online. This will allow us to post publications in accordance with these indicators. In order for the posts to see the largest number of users subscribed to the page.
The data in the next column “Types of publications” will help us to understand what types of content are most interesting for the subscribers.
The data of the last column “Top publications” show us popular pages of competitors or pages that we like. Thus, we can track and analyze the statistics of top publications of competitors and other pages. Add pages of interest to us in the “Overview” section, the column “Interesting Pages”.
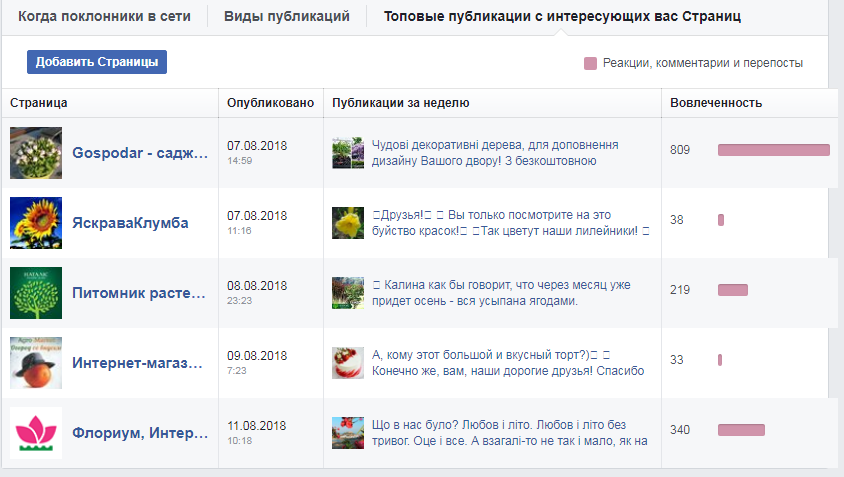
Moreover, the main indicators of this subsection are the coverage schedule, the number of clicks on publications and social reactions under each publication. Thanks to these data, you can clearly see all the statistics on the published content of the page. We are to highlight the ability to track whether users are hiding the published content or complain about it as a spam – that is, what content negatively affects the indicators.
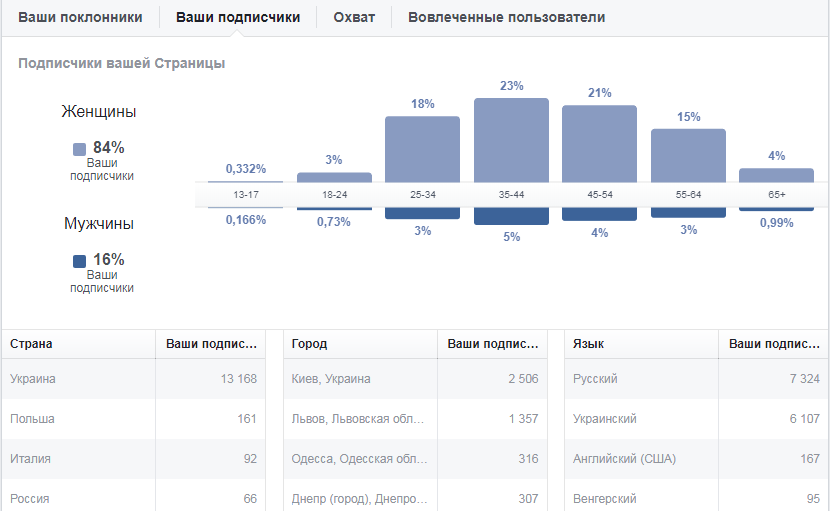
The analysis of data in the “Users” subsection
The last interesting subsection in this collection gives an opportunity to study the demographic and age data of the page audience. Here there is a division of men and women, the percentage of the age of subscribers, the country and the city in which they are located. In neighboring columns, demographic indicators of fans and involved users.
So, the data of the section “Statistics” give an opportunity to learn and analyze information about the audience that is interested in the content of the page, with what publications on the page people are more willing to interact. Thanks to all the key indicators, you can improve the published materials. Moreover, it is an opportunity to increase the number of people who interact with the company through the page. Follow the statistics and create cool content for all users from your page.